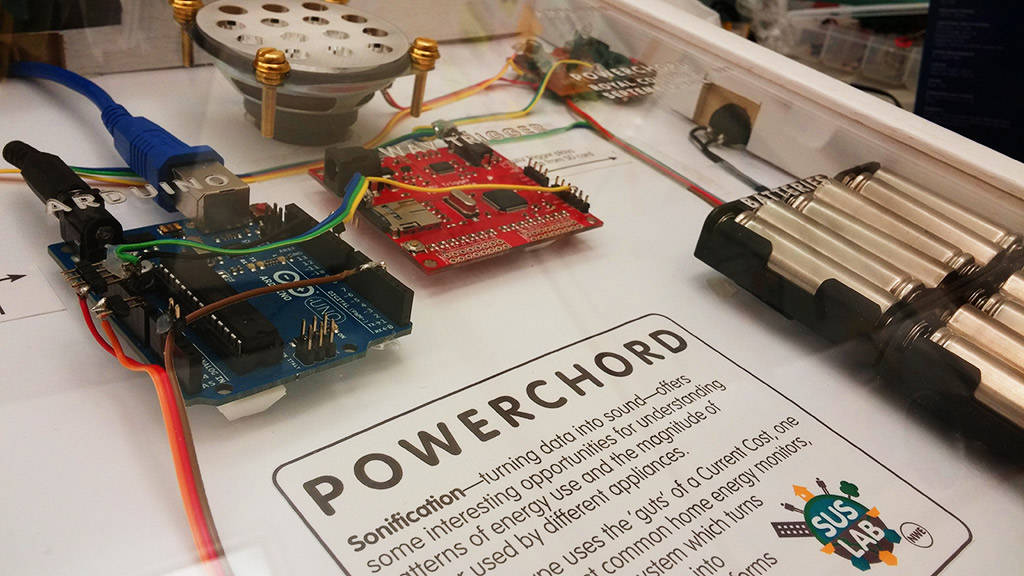
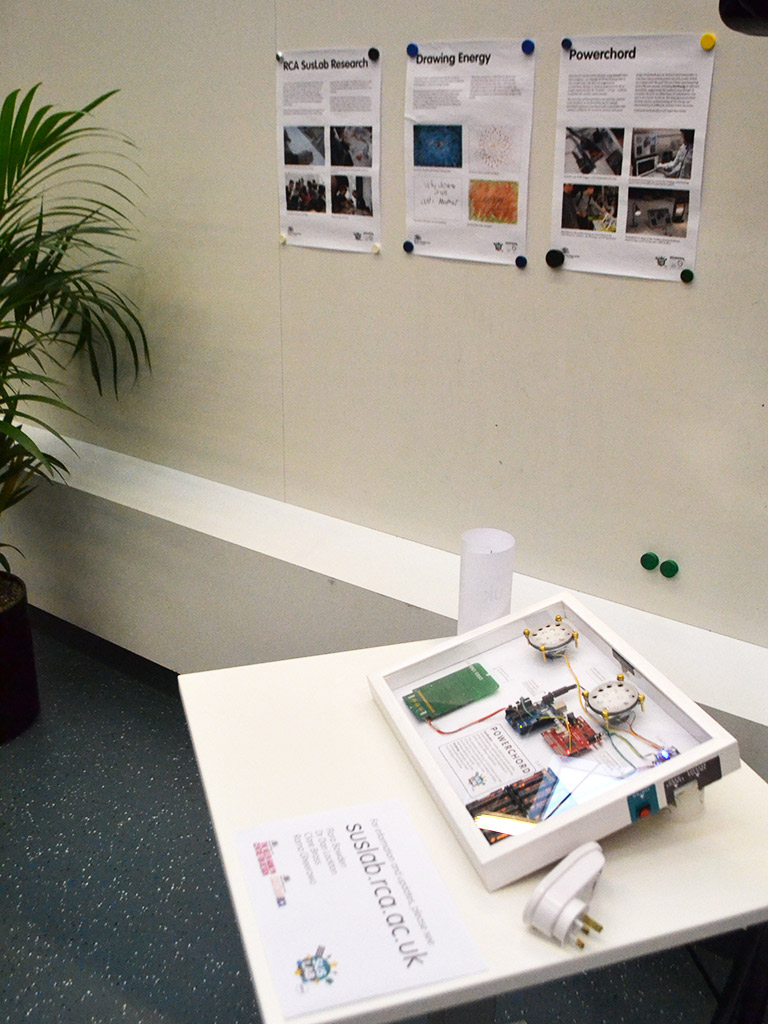
Powerchord is an ongoing (2014—) exploration of sonifying energy use in near-real time. The prototypes developed so far monitor multiple household electrical appliances in parallel, turning readings of the instantaneous power being drawn into various kinds of sound, providing a form of ambient experiential feedback intended to fit with the soundscapes of everyday domestic life, while (perhaps) enabling a deeper understanding of the characteristics of energy use. The concept was developed, working with Flora Bowden, from ideas suggested by householders during co-creation sessions as part of the European SusLabNWE project, funded by INTERREG IVB, as part of our wider exploration of the invisibility of energy at the Royal College of Art’s Helen Hamlyn Centre, which also led to the Drawing Energy project. (The next development of the project, Electric Acoustic, has been funded by Carnegie Mellon’s College of Fine Arts.)

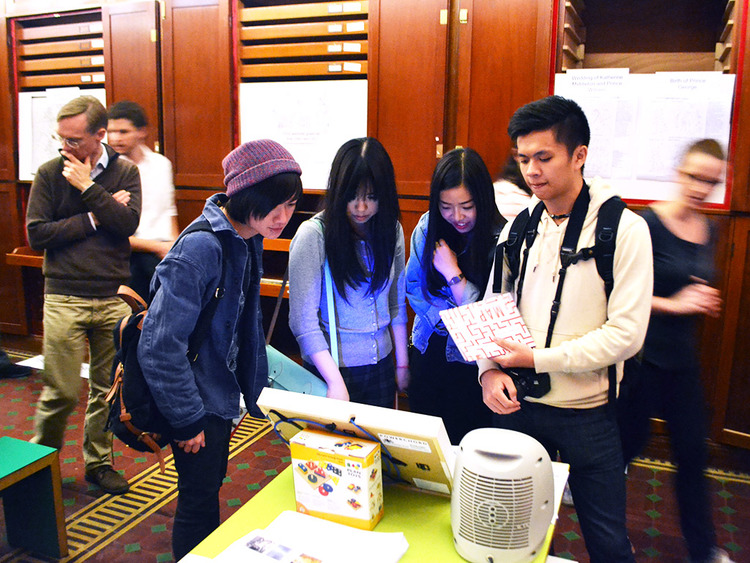
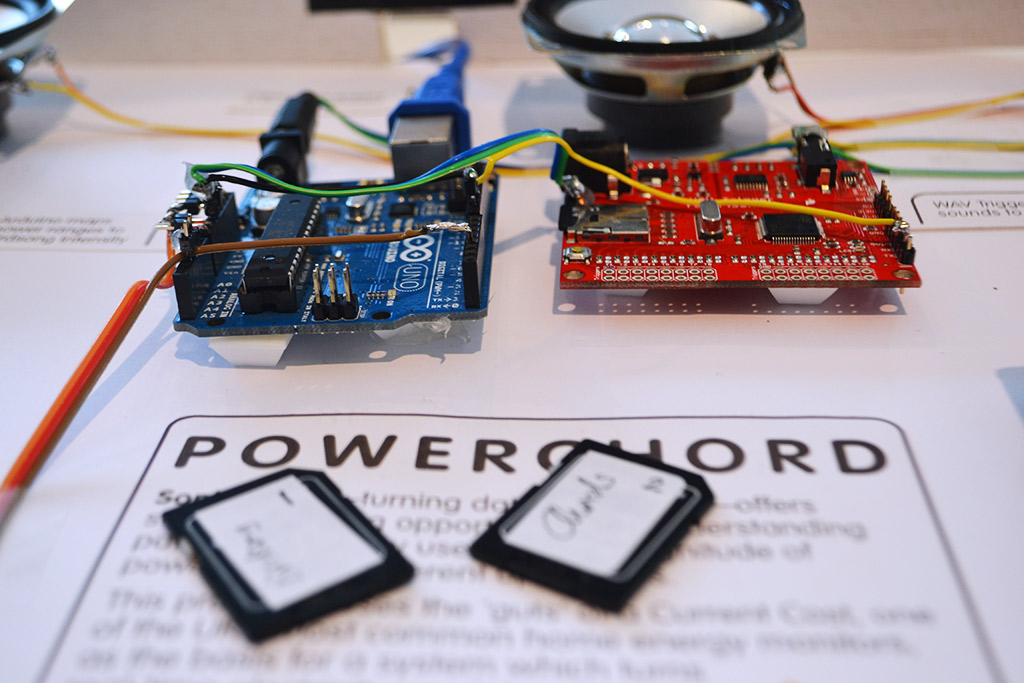
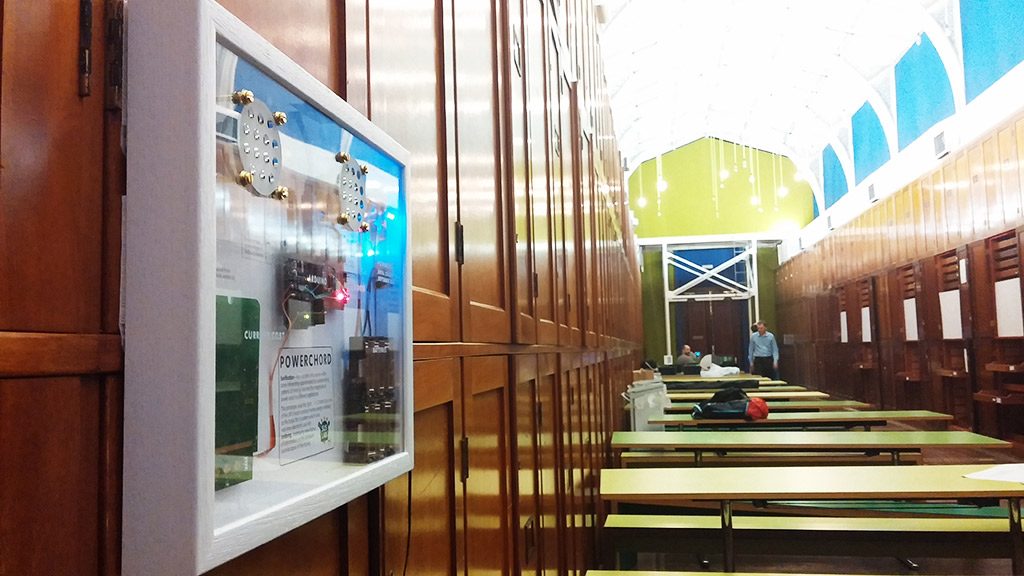
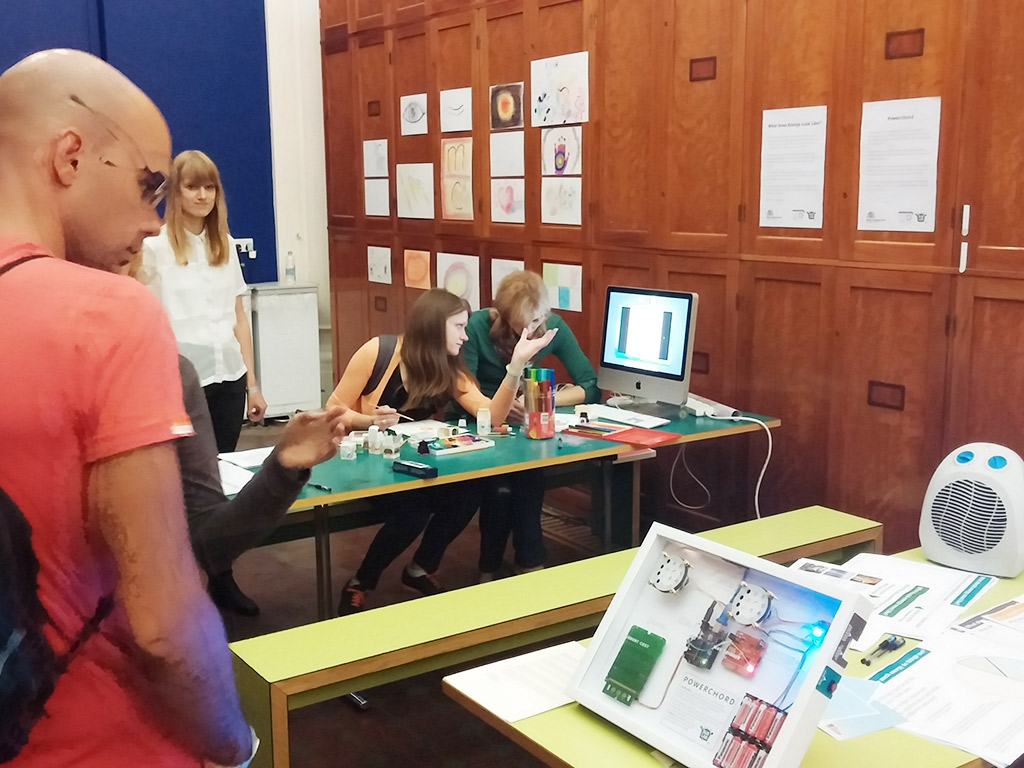
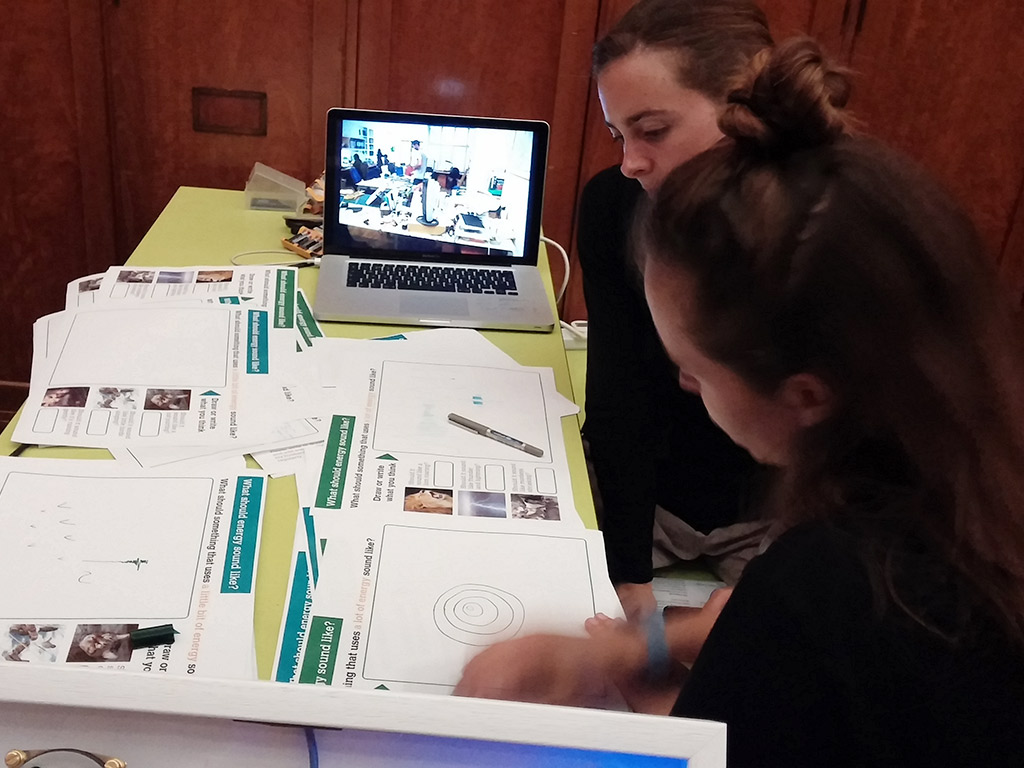
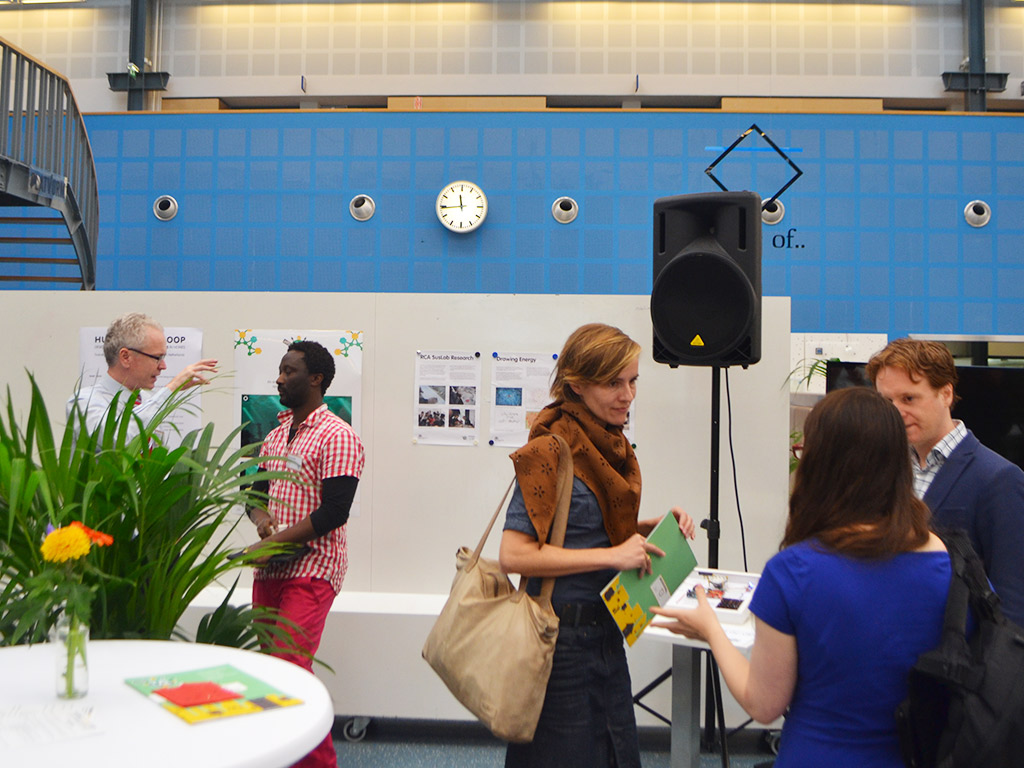
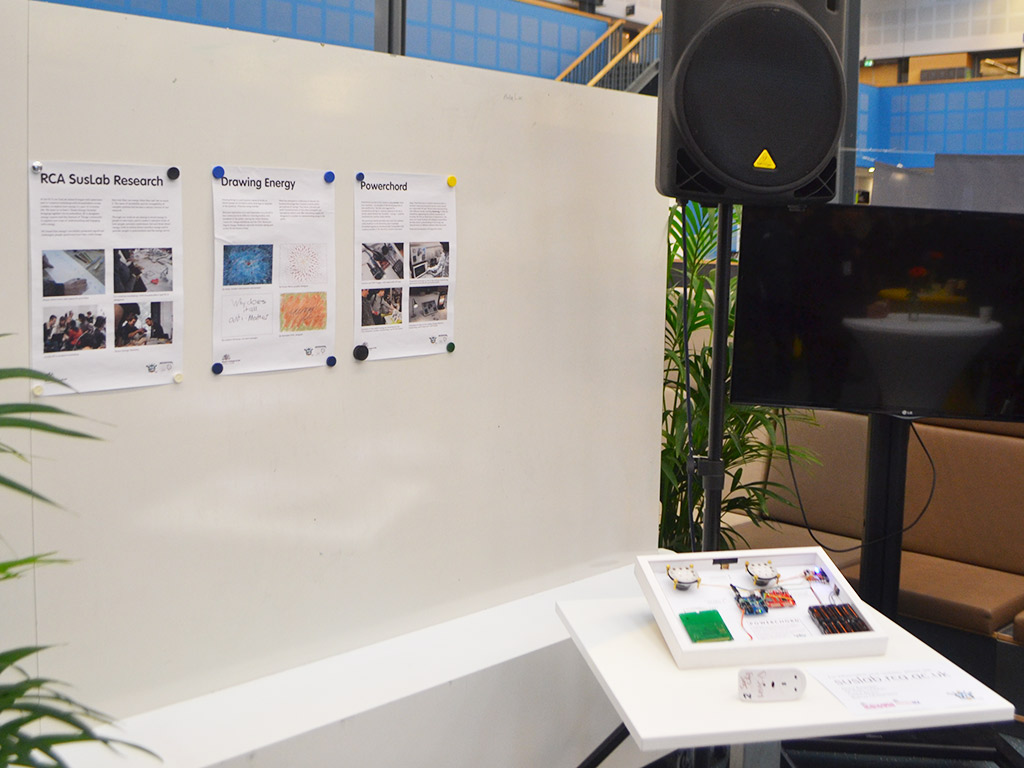
Powerchord is designed to use swappable micro-SD cards with sound ‘families’ on them, so complementary (or not) schemes can be chosen or compiled. The version in the videos on this page uses varieties of birdsong, of different intensities—from recordings at xeno-canto.org—but initial experiments centred around chords (hence the name) and direct synthesiser mapping, which sounded awful. Working with Claire Matthews, a wider range of sound schemes has subsequently been produced, drawing on ideas suggested by members of the public at the 2014 V&A Digital Design Weekend after they tried it out. The project has also been exhibited, at different stages, at V&A Digital Futures, the UK Art Science Prize, TU Delft’s ‘Human in the Loop’ exhibition, and the RCA Helen Hamlyn Centre show, and is illustrated in the Royal Academy of Engineering‘s Built for Living report. Two conference papers and two book chapters about Powerchord have been published:
- Dan Lockton, Flora Bowden, Clare Brass, and Rama Gheerawo (2014). ‘Bird-wattching: exploring sonification of home electricity use with birdsong’. SoniHED – Conference on Sonification of Health and Environmental Data, 12 September 2014, York (download PDF)
- Dan Lockton, Flora Bowden, Clare Brass, and Rama Gheerawo (2014). ‘Powerchord: Towards ambient appliance-level electricity use feedback through real-time sonification’. UCAmI 2014: 8th International Conference on Ubiquitous Computing & Ambient Intelligence, 2-5 December 2014, Belfast (download PDF)
- Dan Lockton, Flora Bowden, and Claire Matthews (2016). ‘Powerchord: Exploring ambient audio feedback on energy use‘. In: David Keyson, Olivia Guerra-Santin, and Dan Lockton (eds.), Living Labs: Design and Assessment of Sustainable Living. Springer, Berlin, p. 297-308. (download PDF)
- Stephen Clune and Dan Lockton (2017). ‘Design for Behaviour Change and Sustainability’. In: Kristina Niedderer, Stephen Clune, and Geke Ludden (eds.), Design for Behaviour Change: Theories and practices of designing for change. Routledge, London. (PDF not yet available)
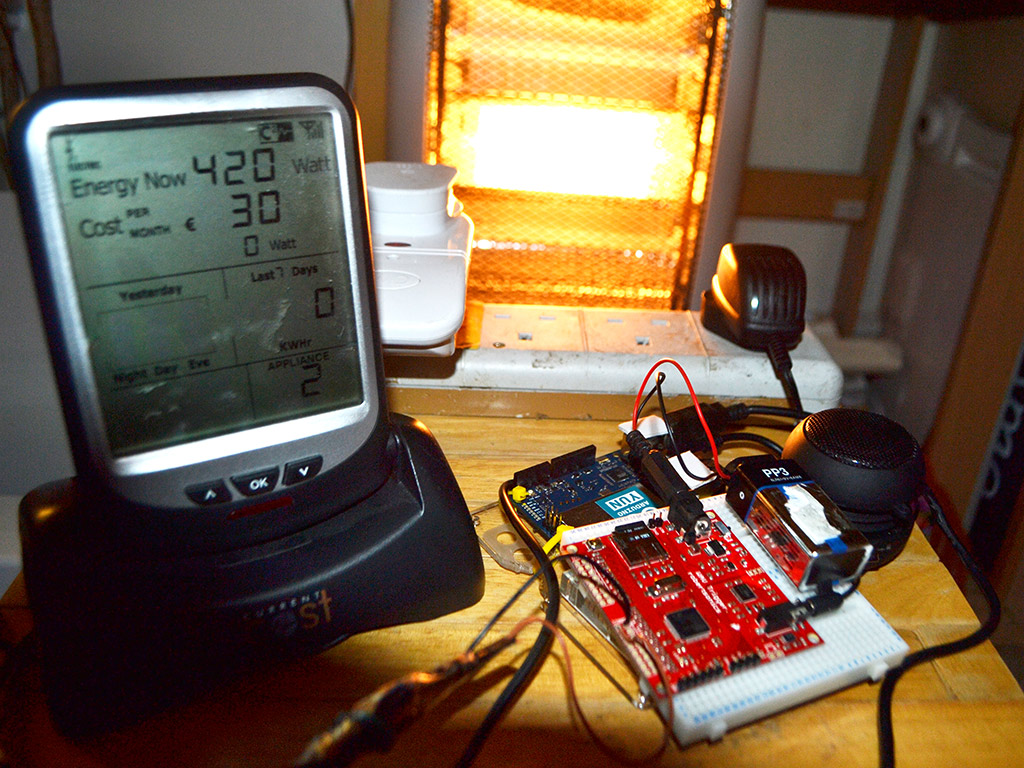
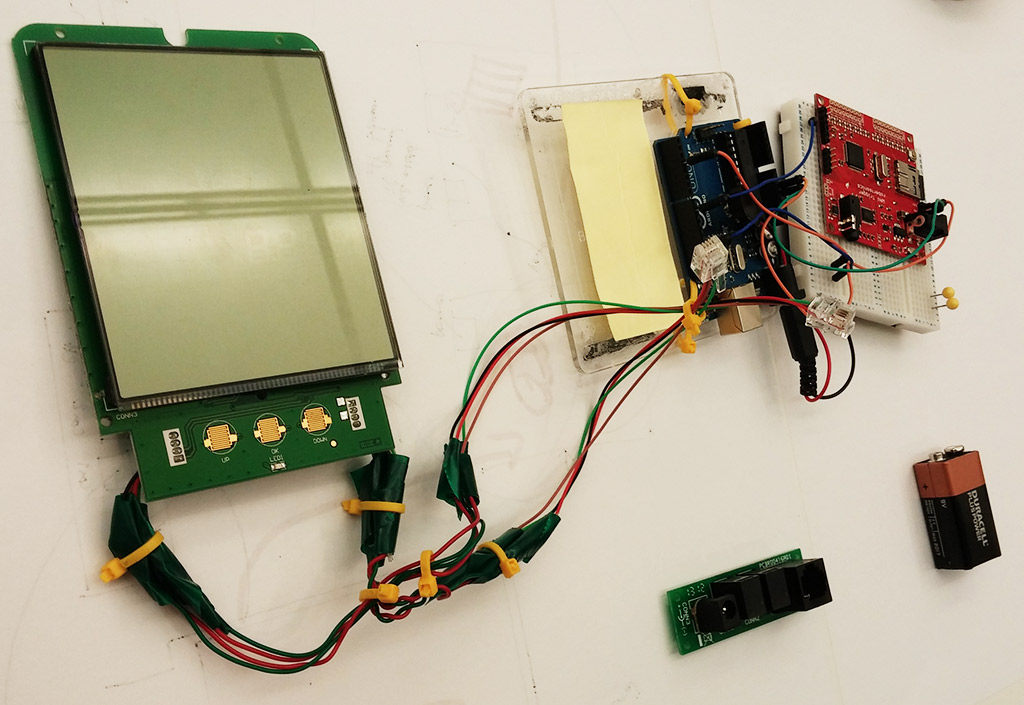
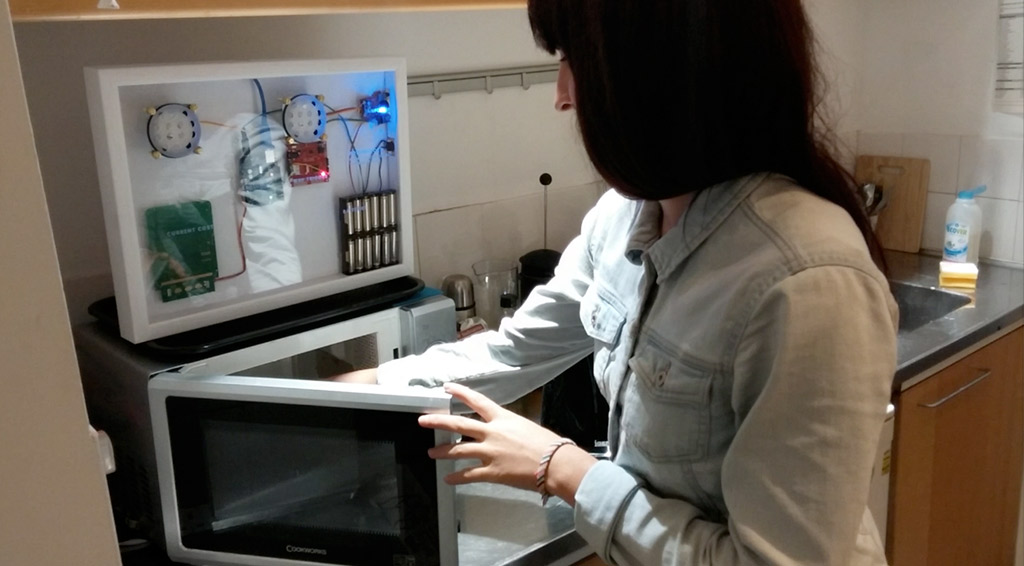
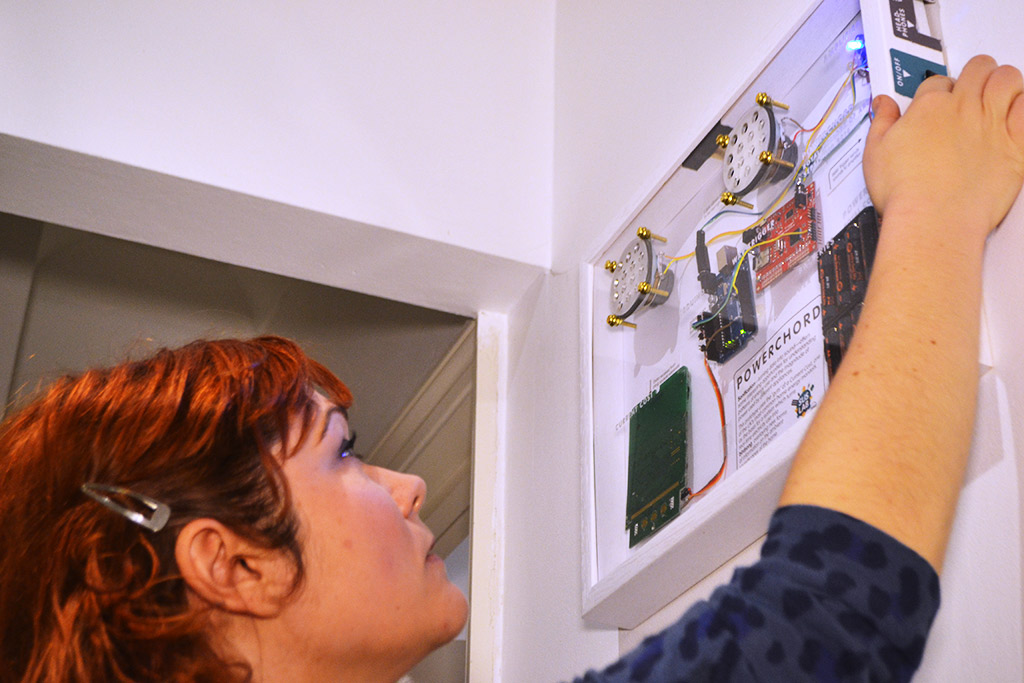
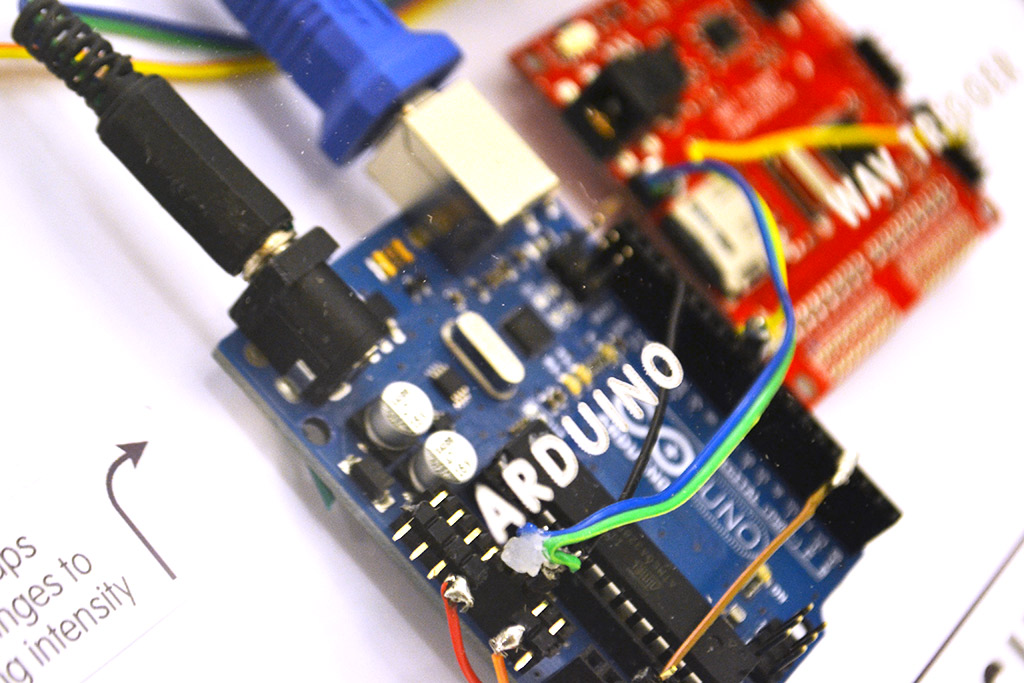
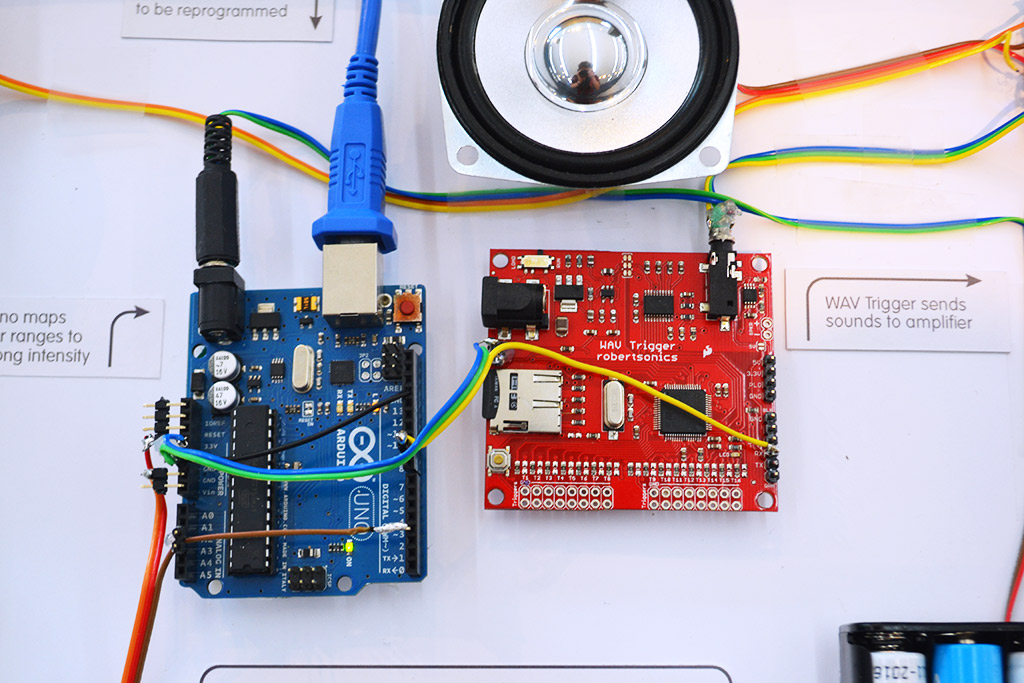
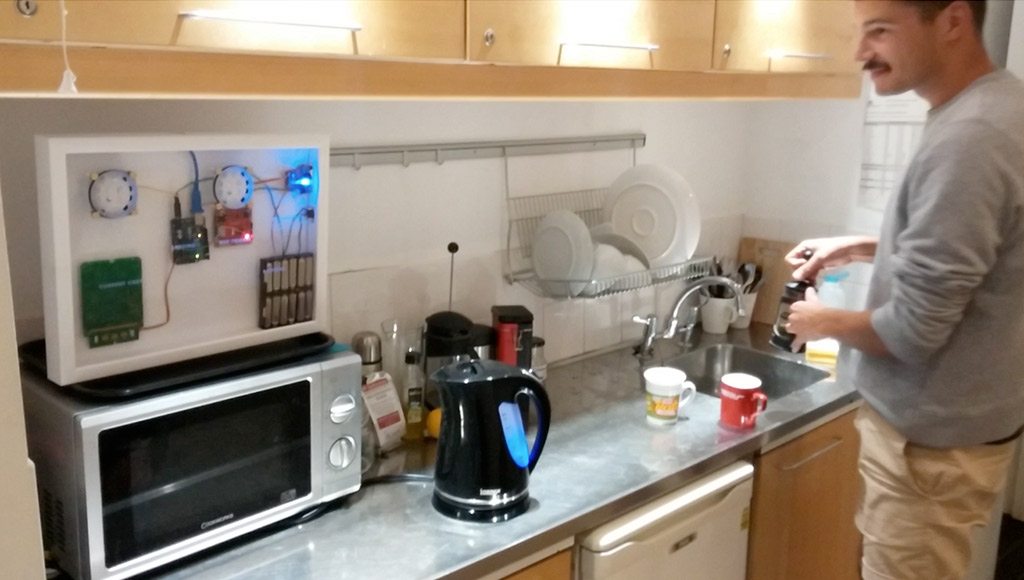
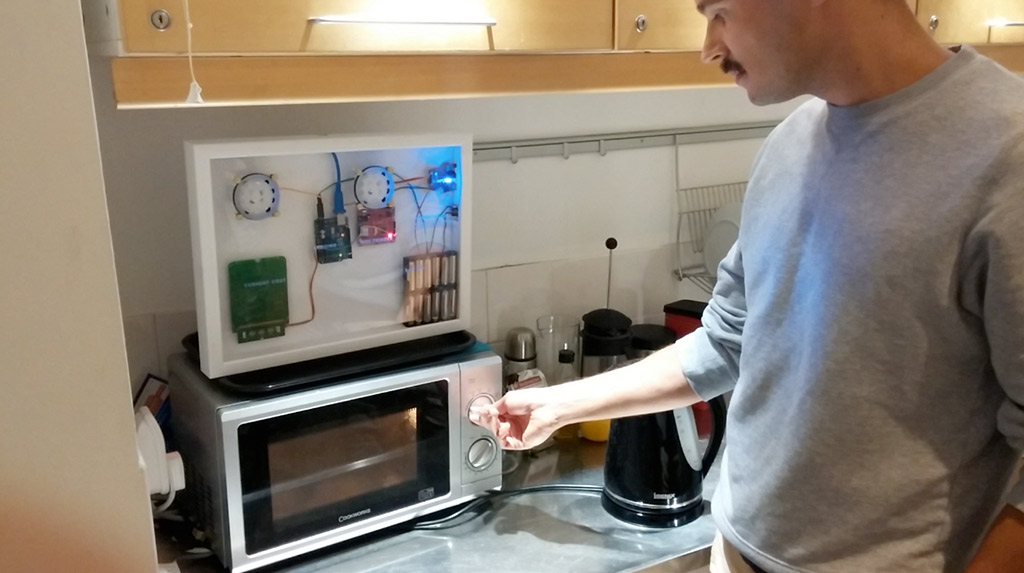
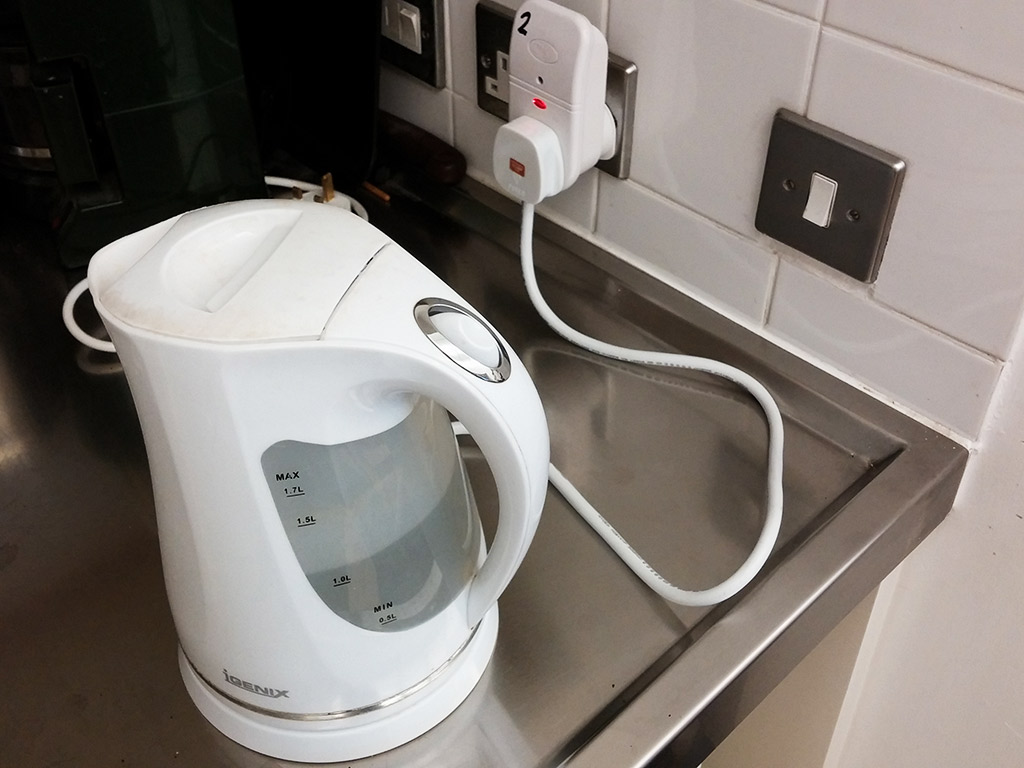
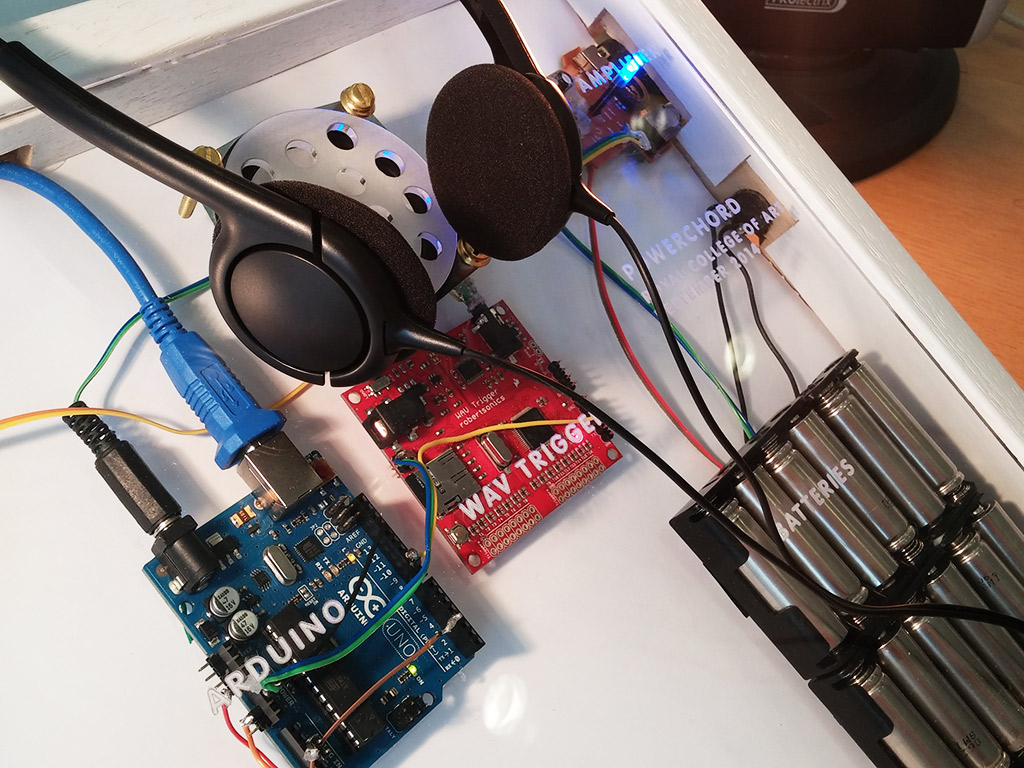
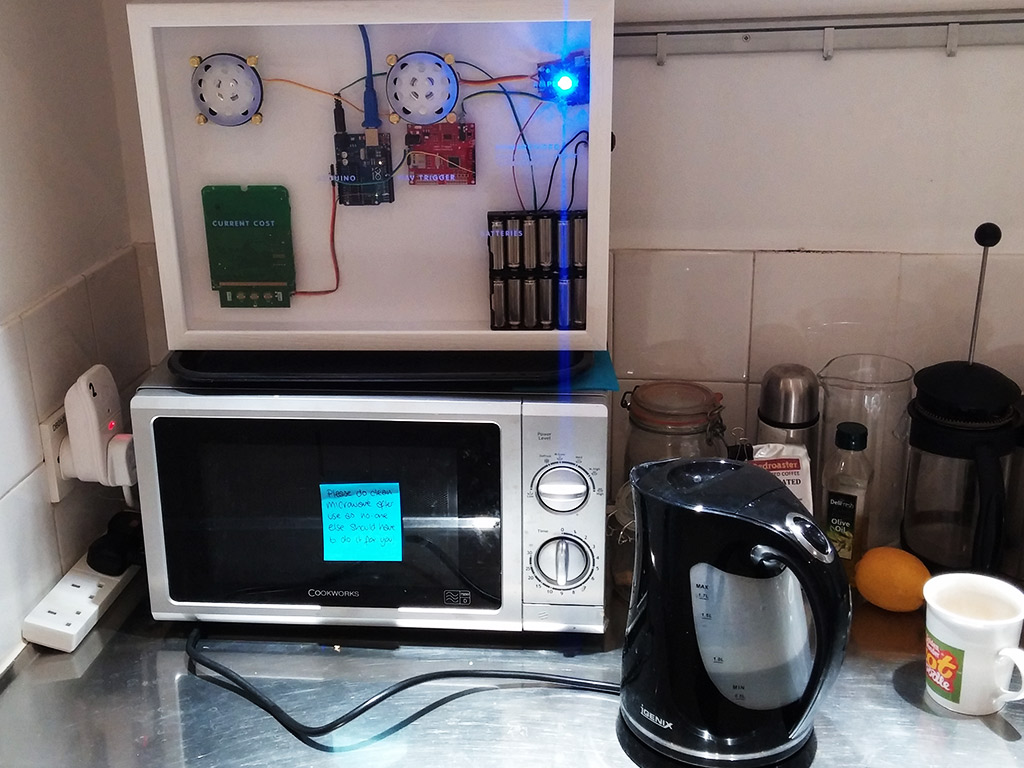
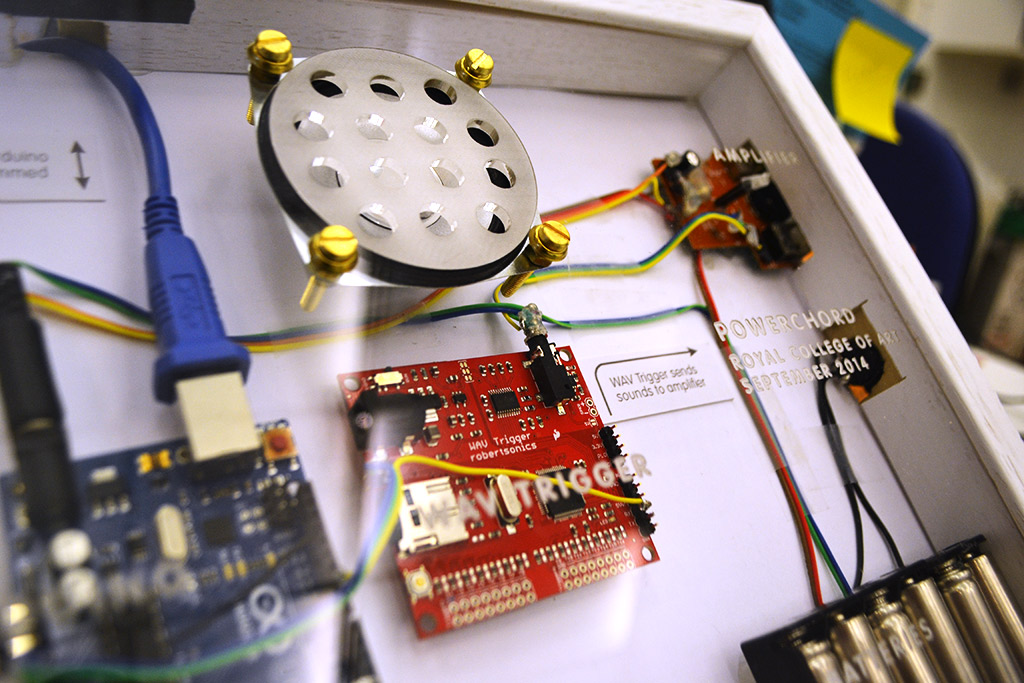
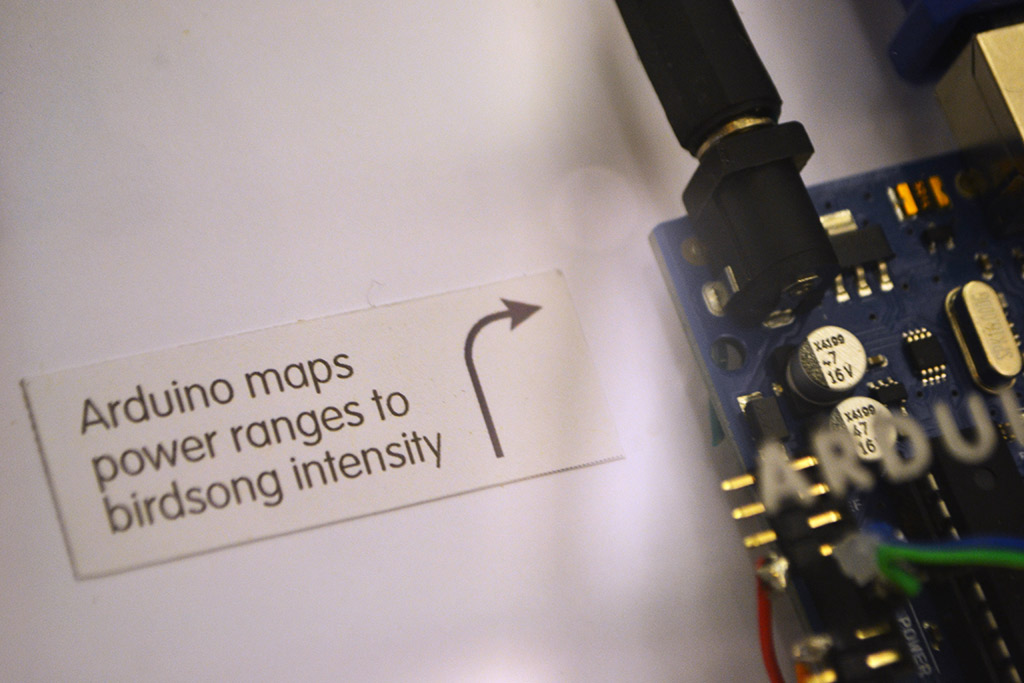
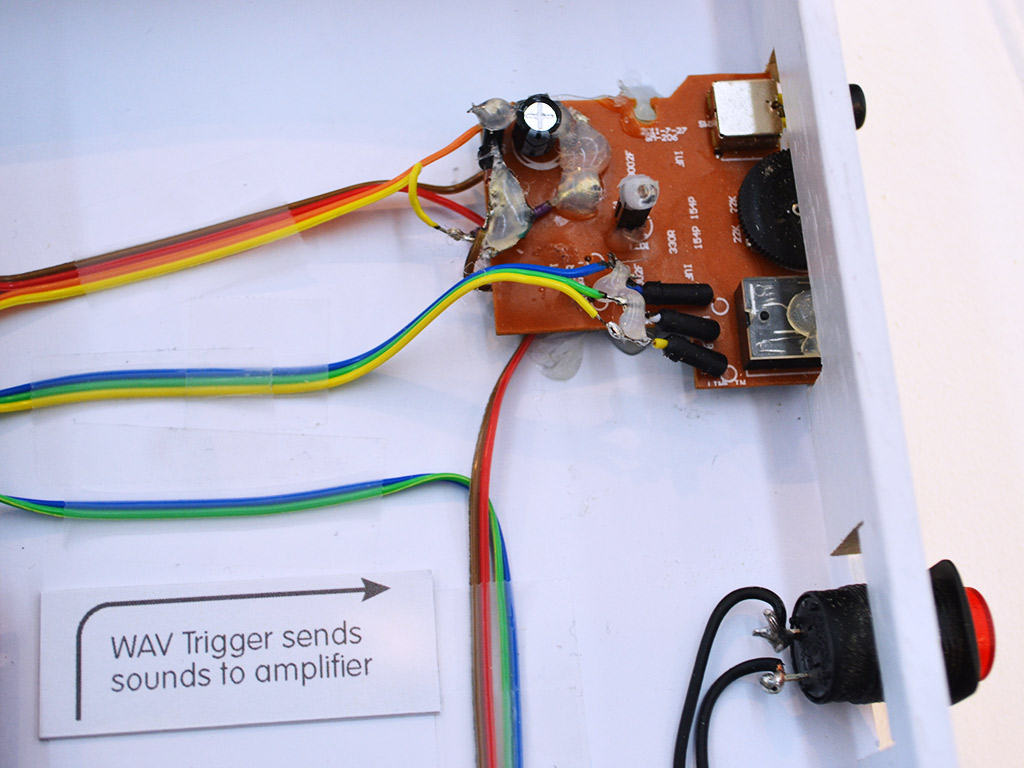
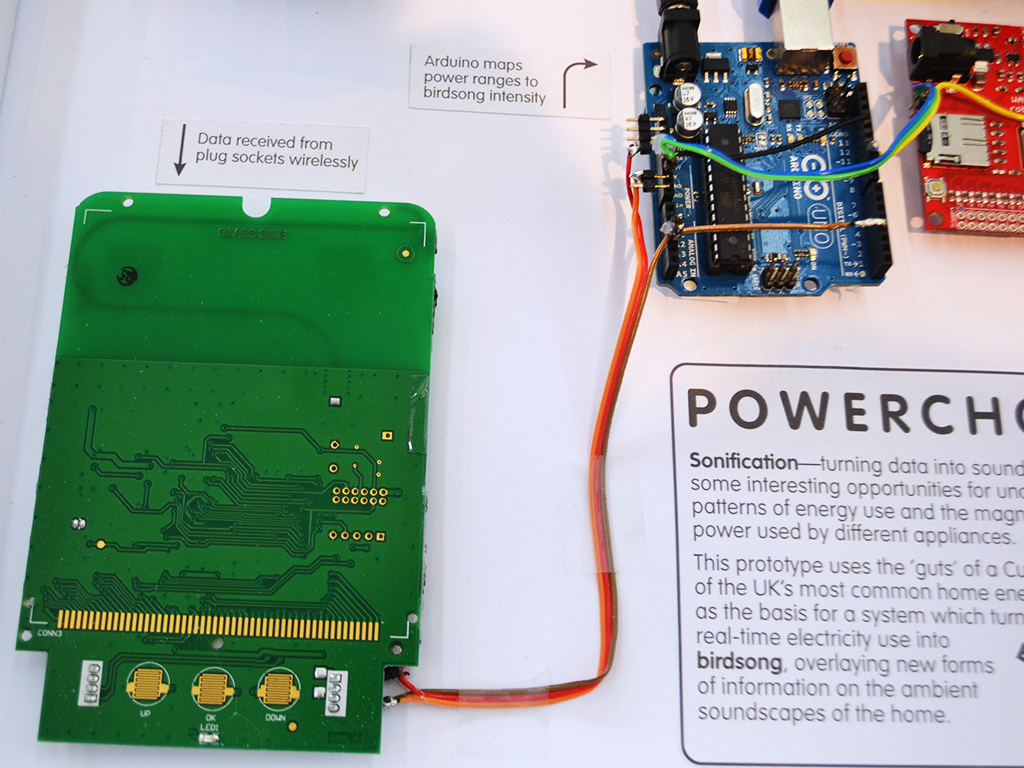
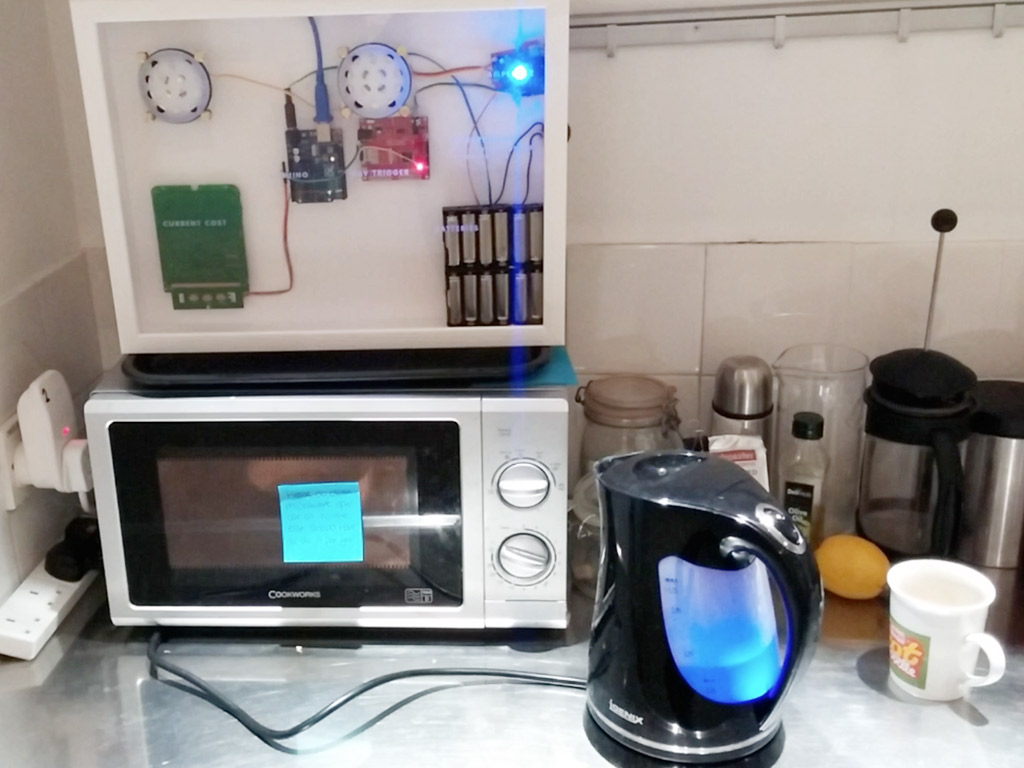
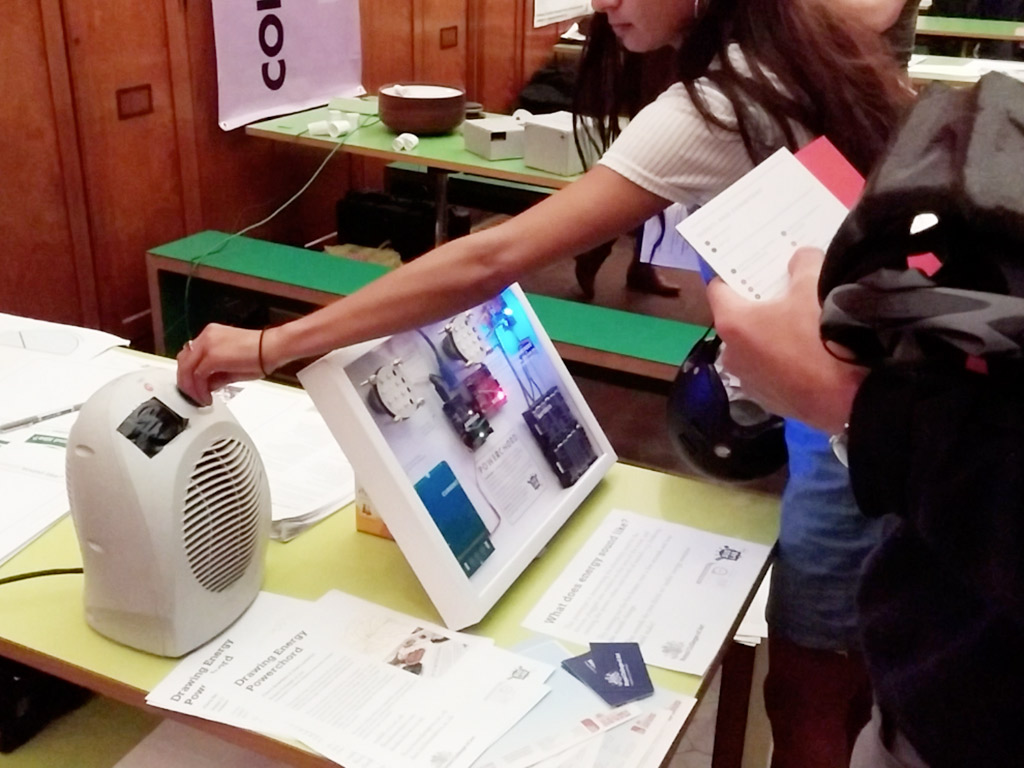
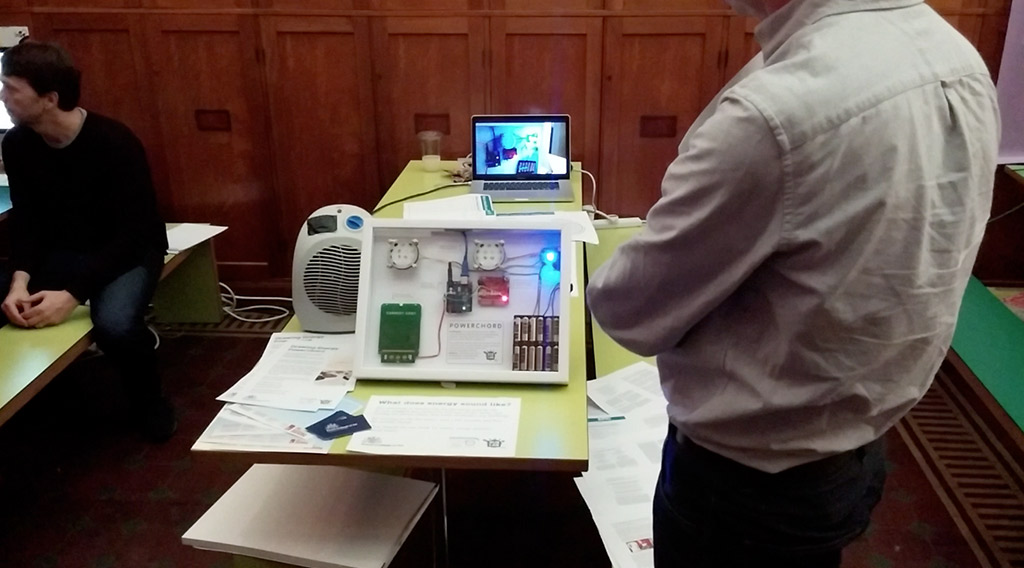
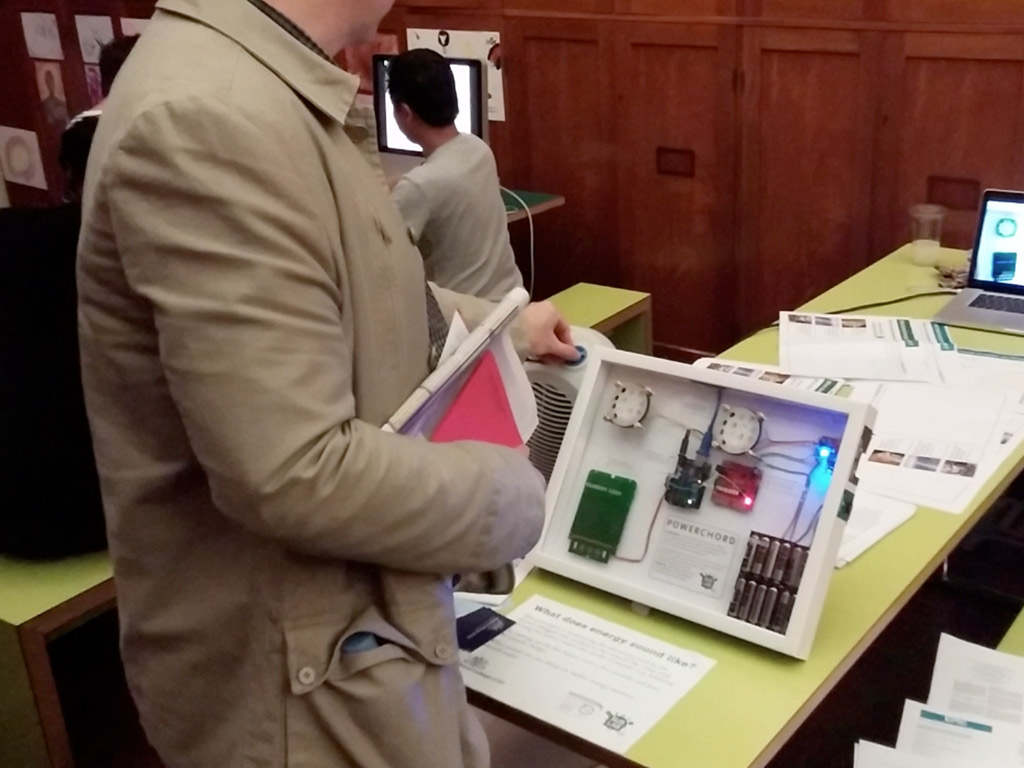
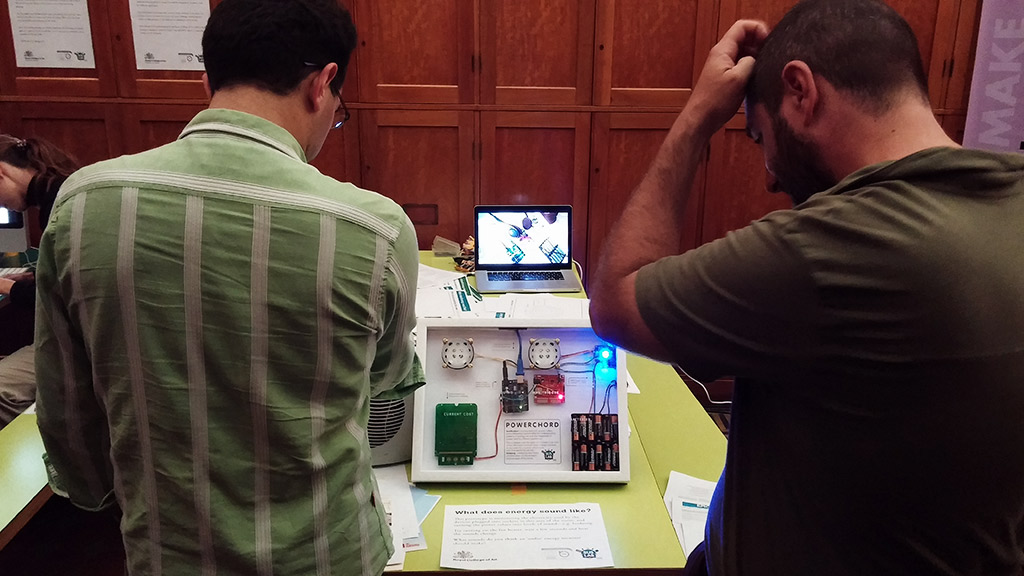
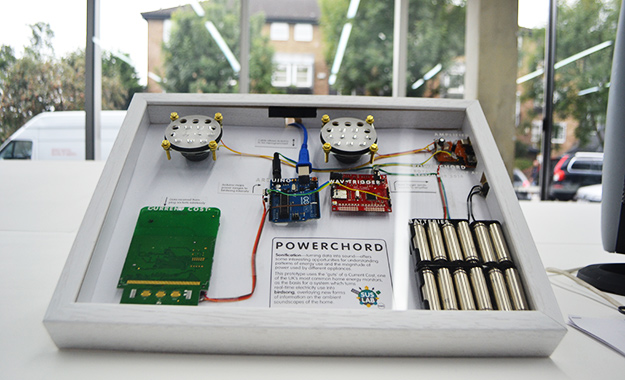
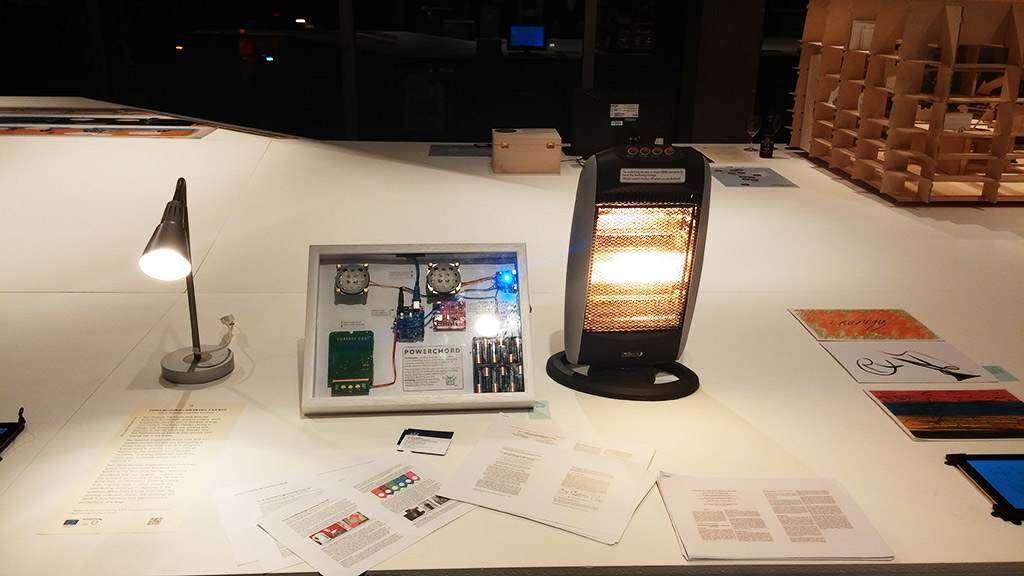
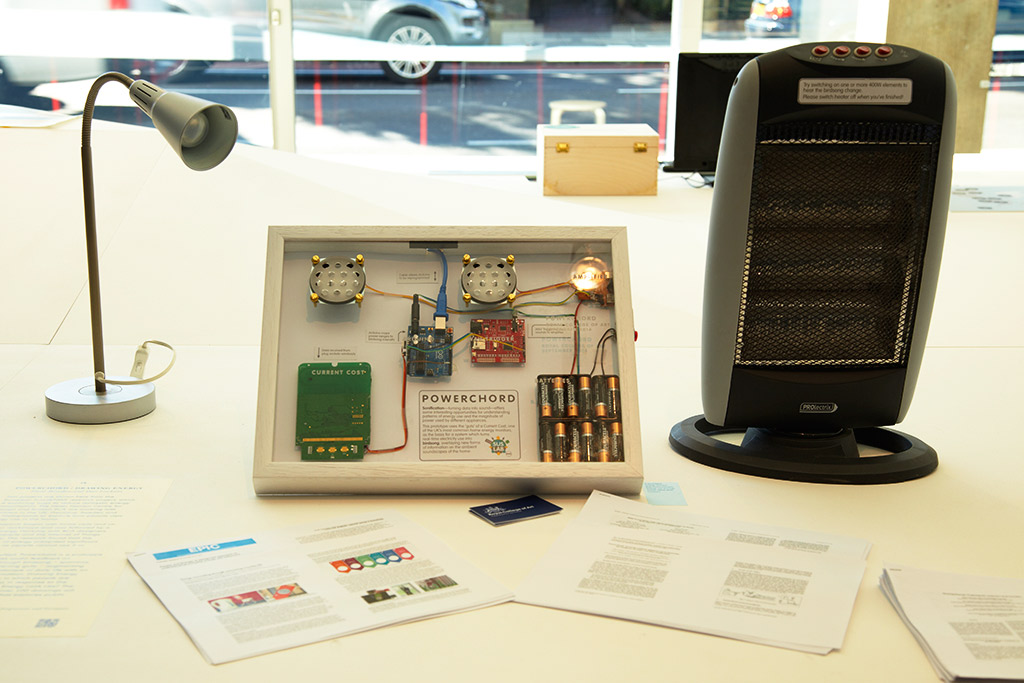
In a sense, Powerchord is a platform for experimenting with energy sonification. The prototypes shown here use the ‘guts’ of a CurrentCost energy monitor (one of the most common UK types—and which can also be used to read gas meter data), which reads power values from wireless individual appliance monitors, and is then connected to an Arduino which reads the XML data stream from the monitor and maps the power levels to particular tracks, played using a WAV Trigger. The next iteration, in progress, is based around a (more reliable) method of using EDF EcoManager transmitter plugs, developed by Jack Kelly at Imperial College London.
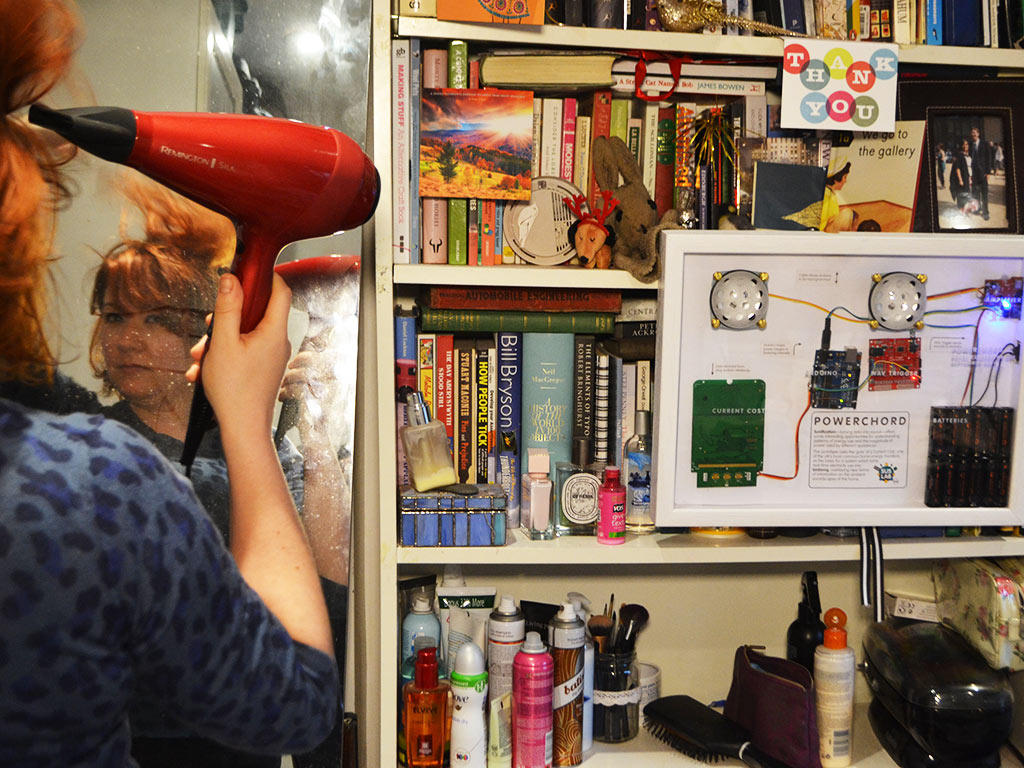
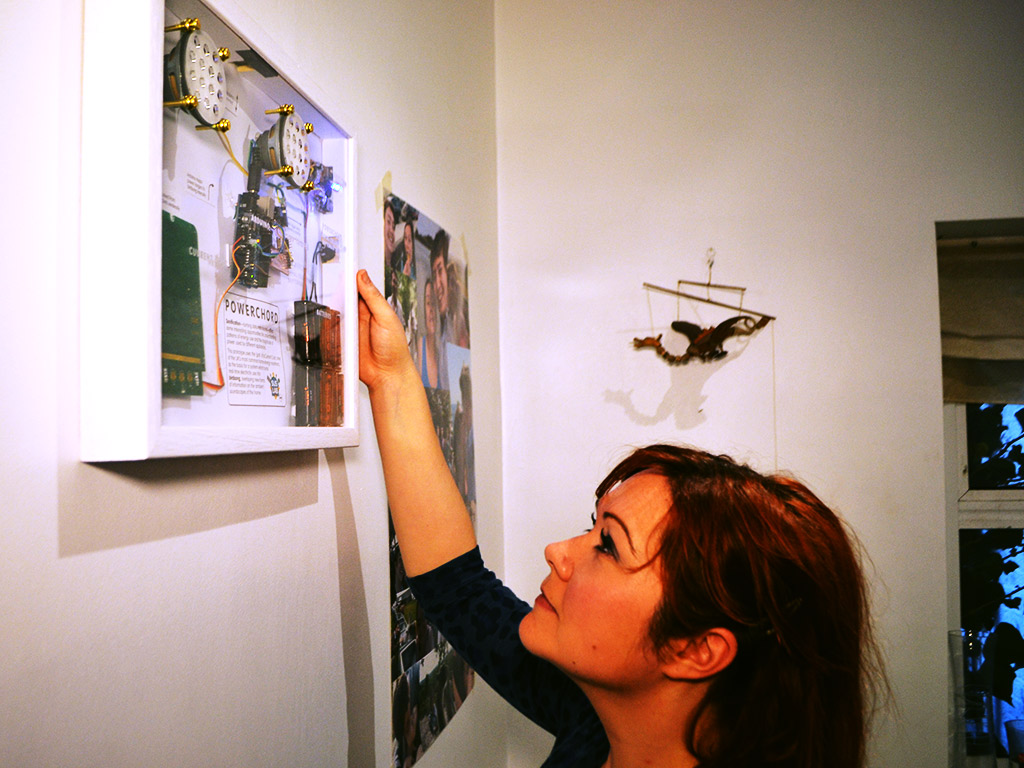
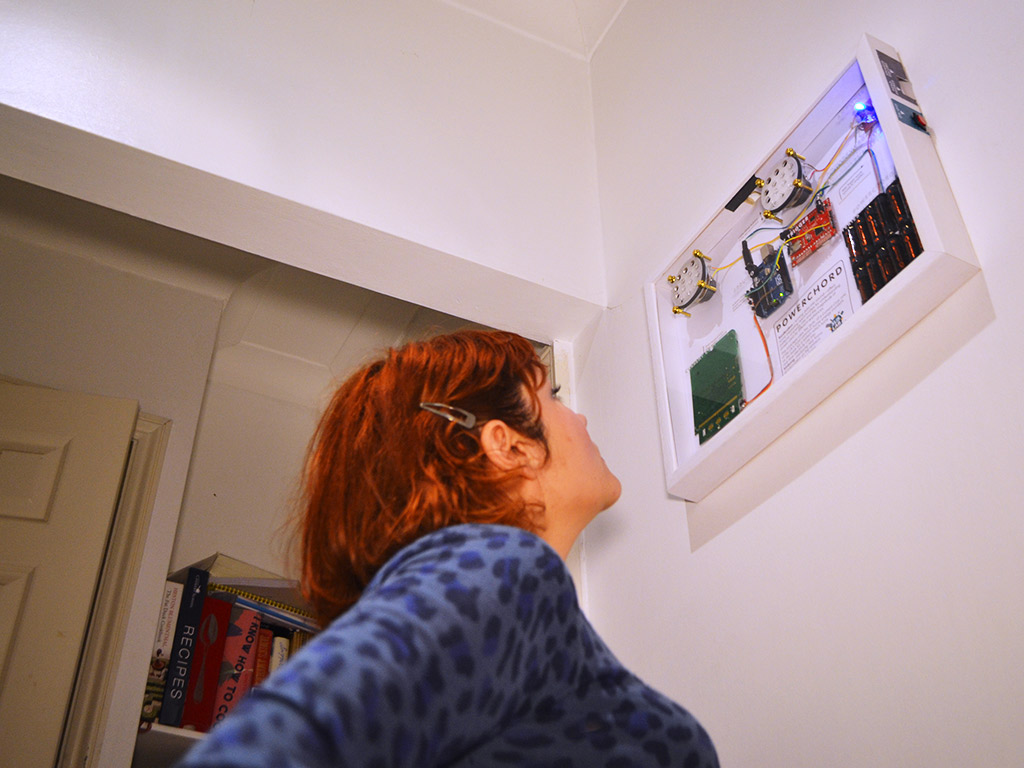
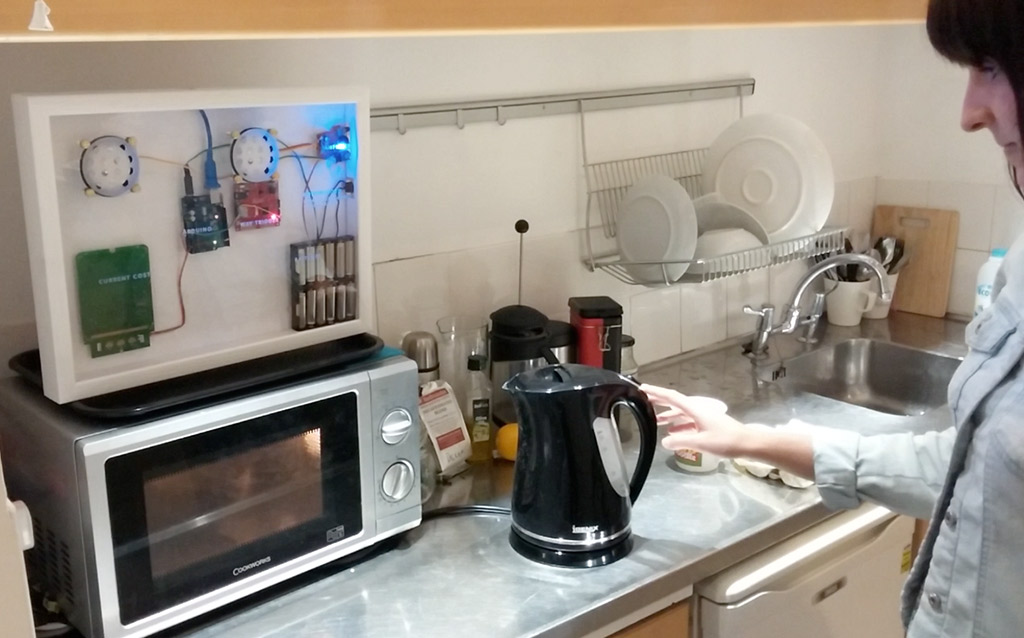
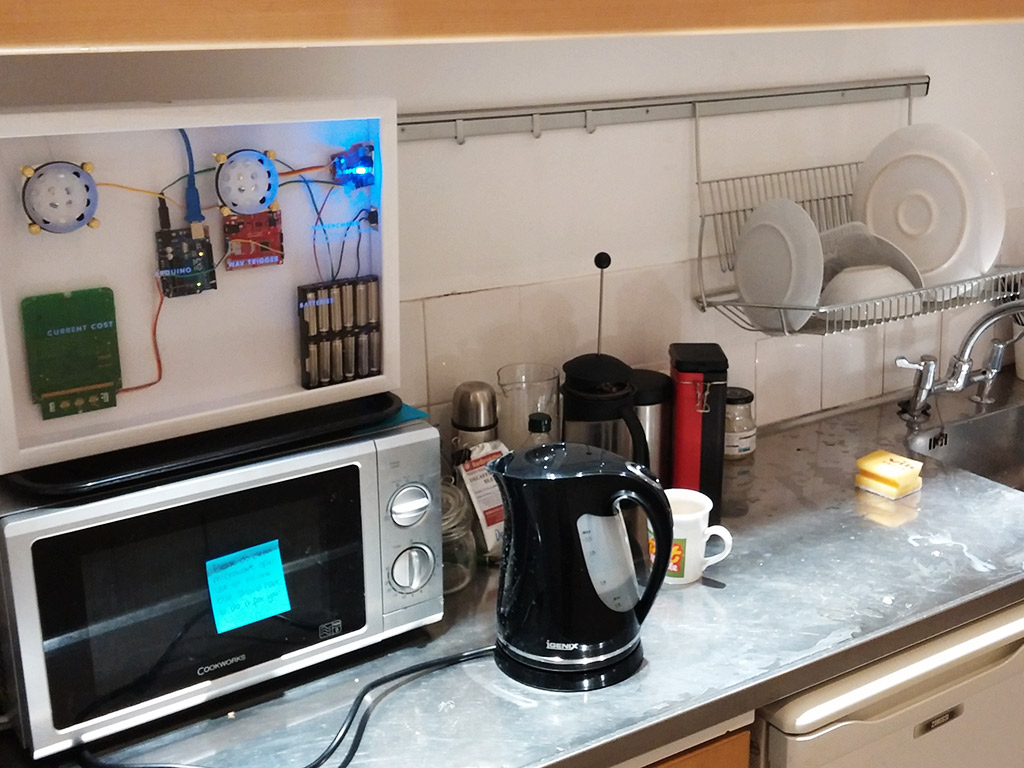
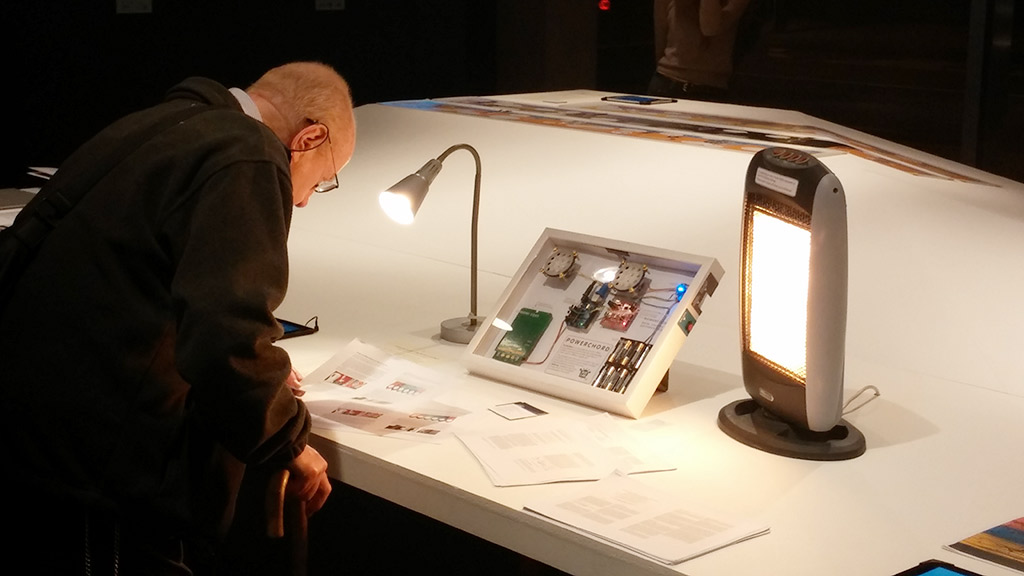
Of course the form here is not fully resolved—the picture frame format was partly to enable it to fit into domestic settings in a way which was obviously different to a conventional energy monitor, but also, perhaps, to attempt to show the system deconstructed, not quite in a Daniel Weil way, but also inspired by Coralie Gourguechon’s work. This is the sort of modern wireless product that doesn’t really need to have any obvious form: it could be in a box, a bag, a tube, anything. It could just be a small hidden unit transmitting to a stereo or home entertainment system, or Bluetooth speakers.


Why do this?
Influencing people’s energy use is a major research topic across multiple technological and social science disciplines. Feedback displays for electricity or gas, and smart meters, which enable additional networked functionality, such as adaptive pricing changes, have shown some influence on people’s actions, but the situation is complex: simple numerical feedback may not take account of the realities of household life, or people’s understanding of units and quantities, nor link people to wider understanding of the energy system. Some work, e.g. by the Interactive Institute, has sought to bring an ‘ambient’ approach. See also the Carnegie Mellon Imaginaries Lab’s exploration of qualitative interfaces (2017—).
The invisibility of energy emerged from interviews and workshops with householders I ran with Flora Bowden as a major issue in householders’ lack of understanding, contributing to energy waste. This suggested opportunities for visualisation beyond numbers, but also non-visually, for example sonification. In co-creation with householders, it was suggested that being able to ‘listen’ to whether appliances were switched on, the relative magnitude and characteristics of their energy use, and what state they were in (e.g. listening to a washing machine will give a good idea as to where it is in its cycle), was potentially useful. There are echoes of early work in calm technology and ubiquitous computing, such as Natalie Jeremijenko’s Live Wire (Dangling String), and Murray Schafer’s concept of soundscapes. Sonification can potentially enable ambient, peripheral comprehension of data with multiple dimensions, including pattern recognition and detecting state changes.


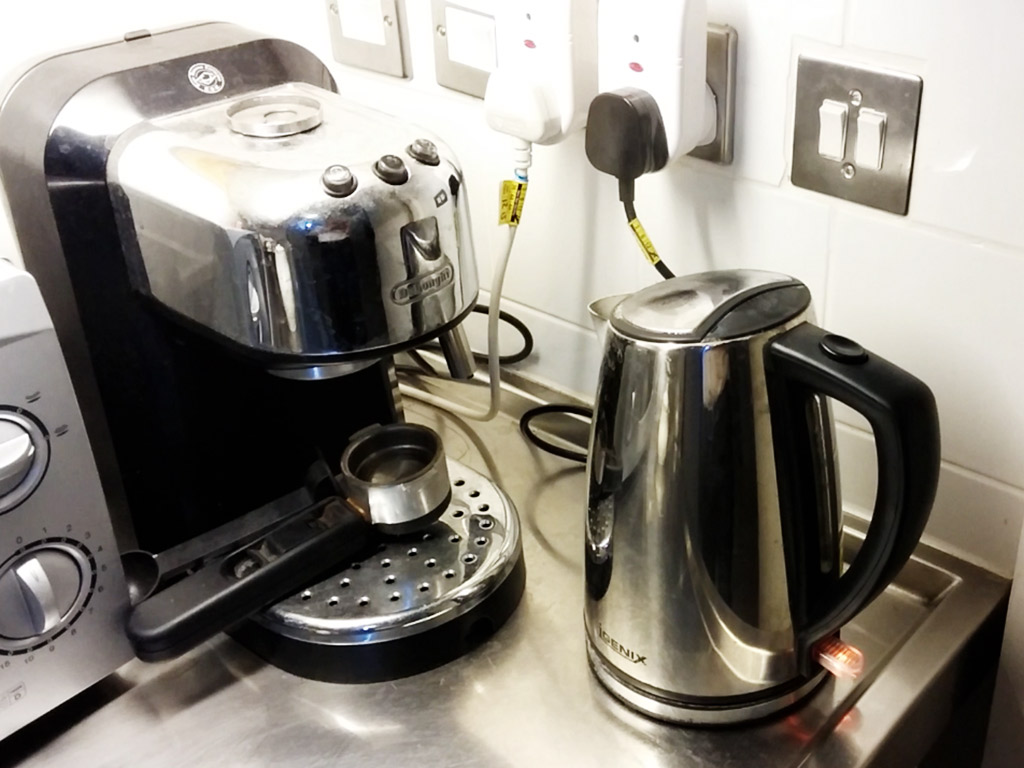
My initial experiments were with summary sonification—in a university office, with a kettle, a laser printer, and a gang socket for a row of desks monitored over 12 hours, turning the power use data into a three-track 30-second MIDI file, with lower pitches representing higher power, and vice versa (a householder suggestion), and hourly drumbeat ‘ticks’.